Mermaid Diagrams
Your supertag hierarchy is invisible inside Tana — you know it’s there, but you can’t see it all at once. Mermaid diagrams turn that invisible structure into something you can see, share, and reason about.
Visualizing your tag structure reveals design patterns, redundancies, and opportunities to improve your Tana setup.
By the end of this lesson, you’ll be able to create Mermaid diagrams of your supertag hierarchy.
What is Mermaid?
Mermaid is a text-based diagramming language:
- Used in GitHub READMEs
- Supported in Obsidian, Notion, and many tools
- Renders diagrams from simple text
graph TD
    A[Todo] --> B[Work Todo]
    A --> C[Personal Todo]
    B --> D[Bug]
    B --> E[Feature]
Supertag-cli generates this text automatically from your actual structure.
Generating Your First Diagram
The basic command:
# Generate Mermaid for your tag hierarchy
supertag tags visualize --format mermaid
Output:
graph TD
    todo[Todo]
    work_todo[Work Todo]
    personal_todo[Personal Todo]

    todo --> work_todo
    todo --> personal_todo
Options:
# Limit depth
supertag tags visualize --format mermaid --depth 2

# Start from specific tag
supertag tags visualize --format mermaid --root task
Using the Output
In GitHub:
- Create a file called
TAGS.md - Paste the Mermaid code in a code block
- GitHub renders it automatically
# My Tag Structure
```mermaid
graph TD
todo[Todo]
...
```In Obsidian:
- Create a new note
- Paste in a mermaid code block
- Preview renders the diagram
In Mermaid Live Editor:
- Go to mermaid.live
- Paste the code
- Export as PNG or SVG
Customizing Output
Control the diagram style:
# Horizontal layout (left to right)
supertag tags visualize --format mermaid --direction LR

# Only show tags with 5+ uses
supertag tags visualize --format mermaid --min-usage 5

# Show field definitions in nodes
supertag tags visualize --format mermaid --show-fields
Output with fields:
graph TD
    todo["Todo\\nStatus, Due Date"]
    work["Work Todo\\nProject, Priority"]
Example: Real Mermaid Output
Here’s what the output looks like from an actual Tana workspace:
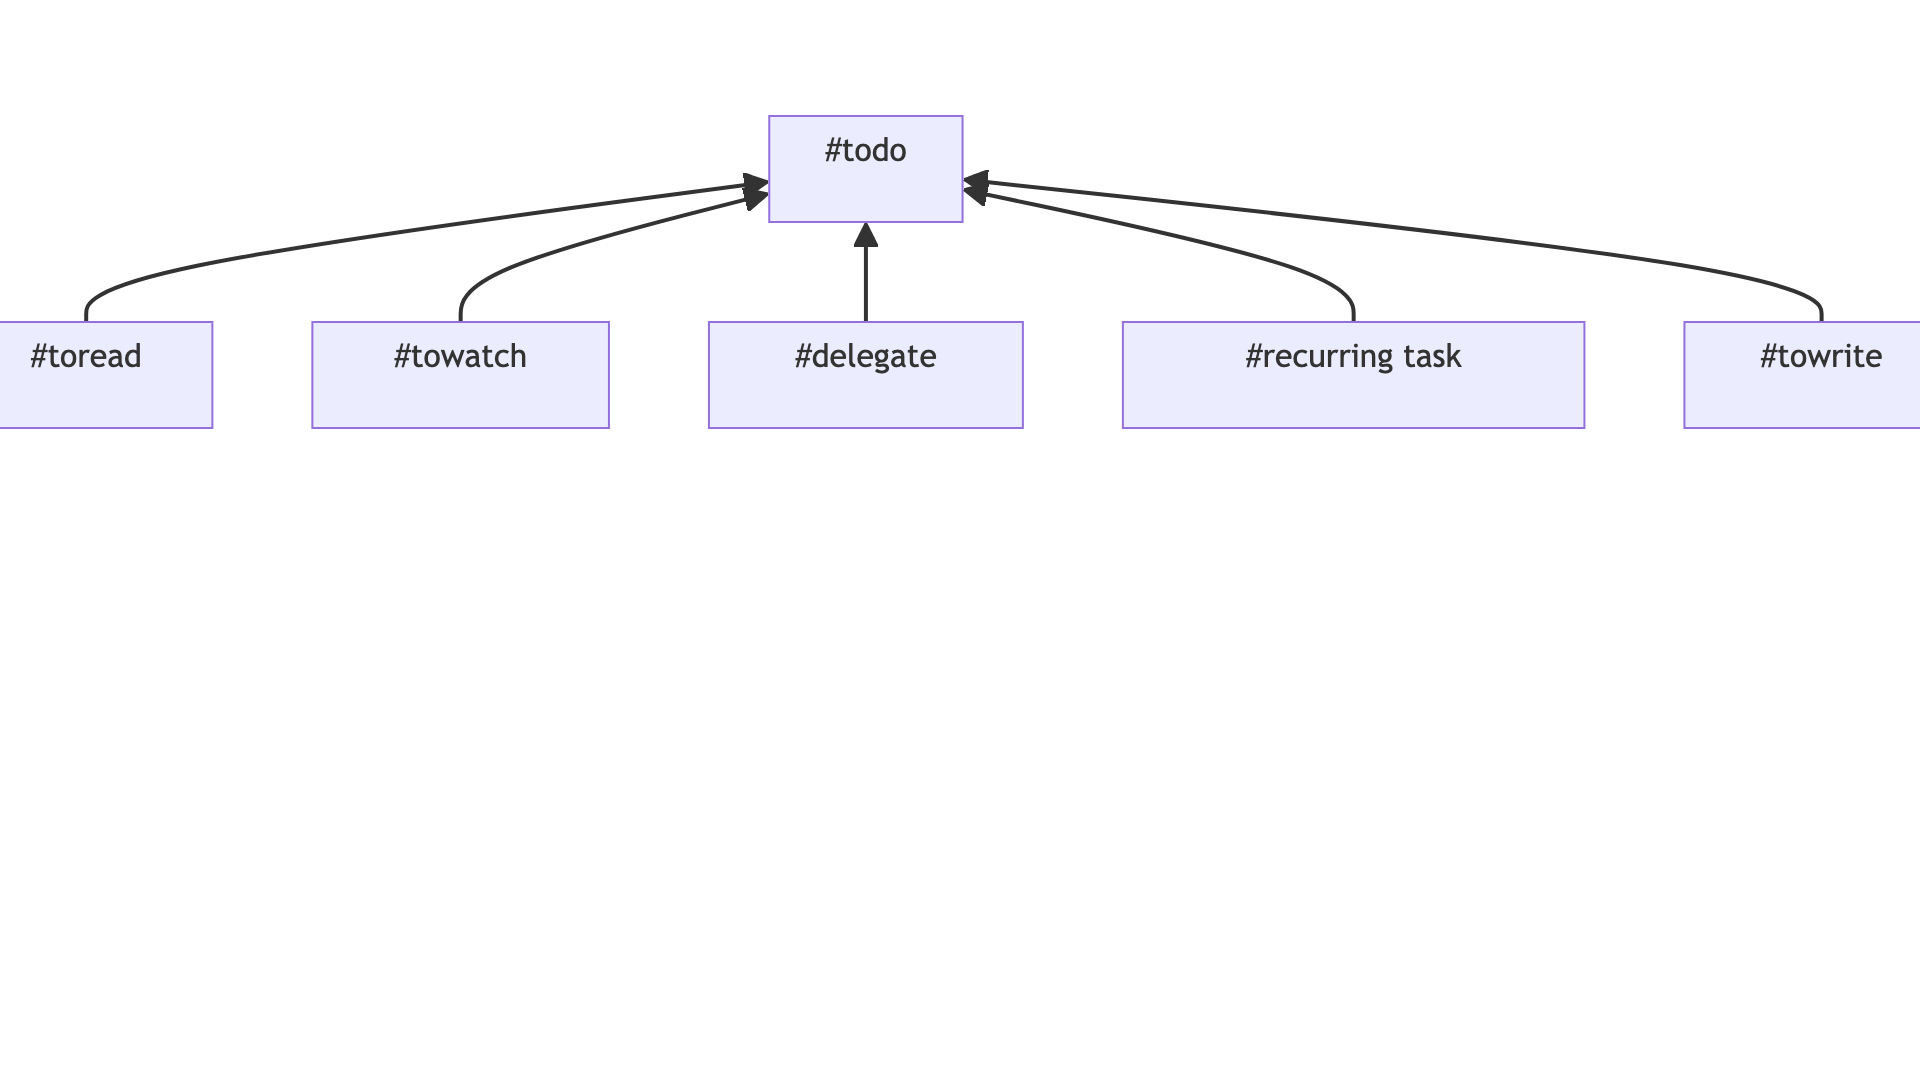
The diagram shows supertag inheritance relationships — parent tags at the top, with child tags flowing downward. Each node represents a supertag from your workspace.
Practice
Exercise: Visualize Your Structure
- Generate your tag diagram:
supertag tags visualize --format mermaid - Copy the output
- Paste into mermaid.live to see it rendered
- Save or screenshot the result
Checkpoint
✅ You have a visual diagram of your supertag hierarchy.
What command would generate a Mermaid diagram of just your “project” tag and its children, going 2 levels deep?
Answer: supertag tags visualize --format mermaid --root project --depth 2
Key Takeaways
- Mermaid turns your invisible tag structure into a diagram
- Output works in GitHub, Obsidian, and many other tools
- Use
--depthand--min-usageto focus the visualization
What’s Next
Graphviz output for more professional diagrams and image export.